Looker Studio, now Data Studio, vs Power BI for an Australian service business: what each costs to build and view, how each updates, and which fits.
IN THIS ARTICLE
Your six clinics run on the practice software and Xero, head office works in Microsoft 365, and marketing lives in Google Ads. Now the owner wants one dashboard that every clinic manager can open, and you've been told it's either Google's tool or Microsoft's.
Here's Looker Studio vs Power BI for an Australian service business like yours: what each costs to build and to view, what each reads easily, how often each updates, and which one fits.
The short answer
Choose Data Studio, formerly Looker Studio, if your numbers sit in Google tools and spreadsheets, or many people view the dashboard: viewers pay nothing and need only a Google account. Choose Power BI if you work in Microsoft 365 on Windows, few people view it, and several systems must agree on definitions, at A$21 a user a month plus GST.
First, the names
Google renamed Looker Studio back to its original name, Data Studio, in April 2026. It's the same product, and existing reports moved across on their own (Google). It's the name you'll see on screen, and either name will find it in a search. Power BI is Microsoft's equivalent.
Both are build-it-yourself reporting tools: software for building your own dashboards from data you connect, more flexible than your accounting software's own dashboard, and more work.
Side by side
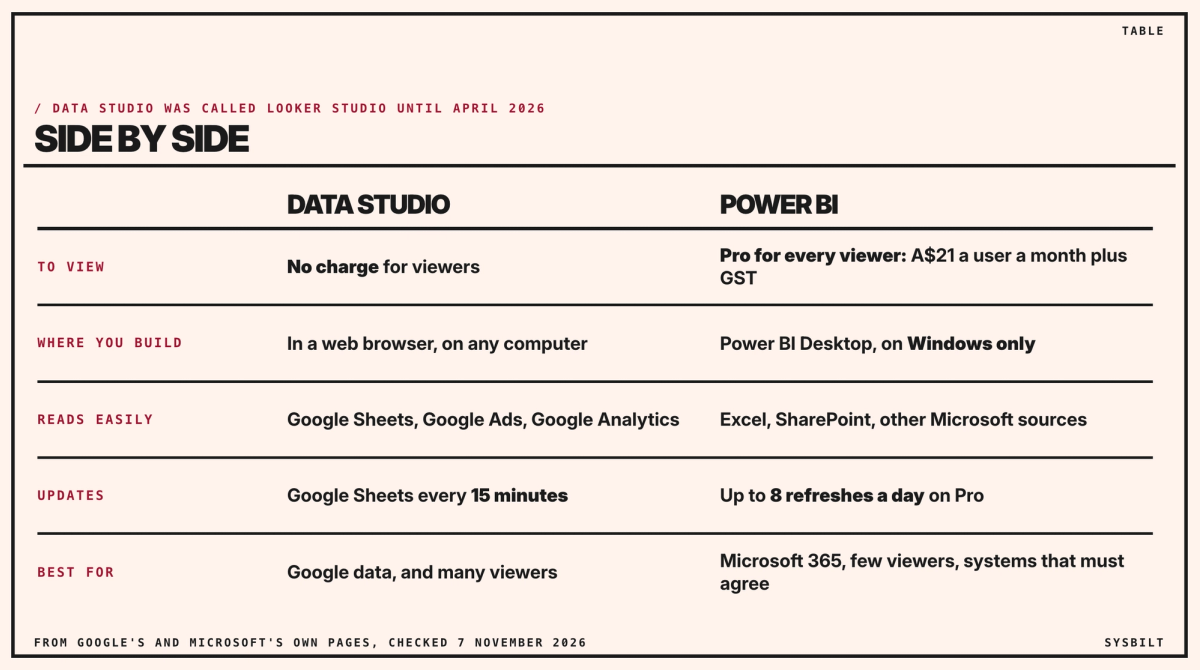
| Data Studio | Power BI | |
|---|---|---|
| To build | No charge | A free account builds reports, but can't share them |
| To view | No charge for viewers | Every viewer needs Pro, at A$21 a user a month plus GST, paid yearly |
| Where you build | In a web browser, on any computer | In Power BI Desktop, which runs on Windows only |
| Reads easily | Google Sheets, Google Ads, Google Analytics | Excel, SharePoint and other Microsoft sources |
| Xero and practice software | No connector of Google's own: a spreadsheet in between, or a connector sold by another company | No connector in Microsoft's list: the same two routes |
| How often it updates | Google Sheets every 15 minutes by default | Up to 8 scheduled refreshes a day on Pro |
| Each manager sees only their clinic | Yes, by filtering on the viewer's email, with each viewer signed in to a Google account | Yes, with row-level security |
| Combining several systems | Blends, for up to five sources | A data model, built for many sources that must agree |
| Learning curve | Gentler | Steeper |
Prices and limits come from each company's own pages, checked 7 November 2026: Google's Data Studio page, Microsoft's Power BI pricing, Microsoft's page on refreshes, and its Q&A on Power BI Desktop for Mac.
Two terms in that table. A blend joins up to five sources on one chart, such as bookings from one sheet and invoices from another (Google). A data model links several tables, such as bookings, clinicians and invoices, through a column they share, the way a lookup does in a spreadsheet. Each calculation, such as revenue per clinician, is written once and used on every page, which is how Power BI keeps several systems agreeing.
Both can show each clinic manager only their own clinic. Whoever builds the dashboard sets this up once. In Data Studio, each row in the sheet carries the clinic manager's email, each viewer sees only the rows with their email, and viewers sign in with a Google account (Google). Data Studio matches each row to one email, so you and the owner, who need every clinic, would open a second copy without the filter. In Power BI, it's called row-level security: a role for each clinic, set up in Power BI Desktop, with each manager added to theirs (Microsoft). Either way, keep patient details out of it. Health details are sensitive information under the Privacy Act, which sets higher standards for them (OAIC), and the dashboard needs totals per clinic, not names or notes.
What it costs for eight viewers
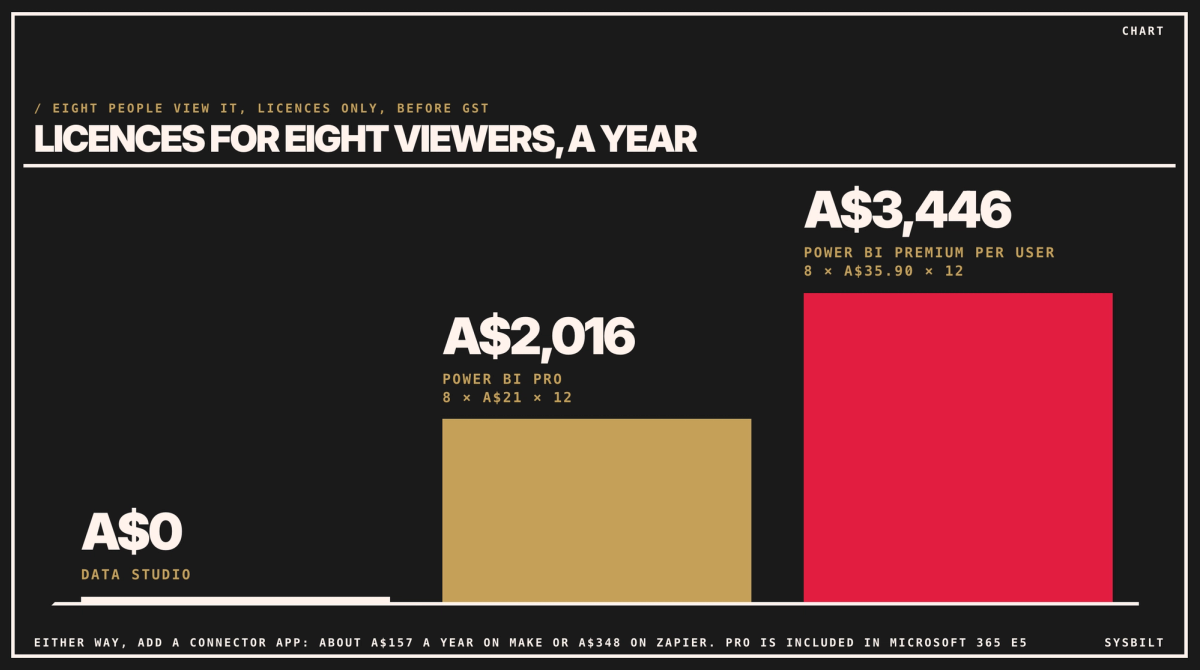
In your group, eight people would look at the dashboard: the owner, you, and six clinic managers. Before you cost Power BI, ask whoever looks after your Microsoft 365 which plan you're on. Pro comes included only in Microsoft 365 E5 and Office 365 E5, and on those plans the Pro line below costs nothing extra.
- Data Studio: A$0 in licences. Each viewer signs in with a Google account, which they can make with their work email at no charge (Google). Its paid Pro version, US$9 (about A$13) a user a month for each Google Cloud project its reports sit in, adds team management and support, which a dashboard like this doesn't need.
- Power BI Pro: 8 × A$21 × 12 months is A$2,016 a year, plus GST, or nothing extra on E5. Viewers sign in with the Microsoft 365 accounts they already have.
- Power BI Premium Per User: 8 × A$35.90 × 12 months is about A$3,446 a year, plus GST. It's Microsoft's larger plan, for bigger data and up to 48 refreshes a day, and a first dashboard doesn't need it.
Those are the licences only. Both routes also need a connector app to fill the spreadsheet in between, about A$157 a year on Make's plan or A$348 on Zapier's, which the section on that spreadsheet explains.
Which one fits
- Choose Data Studio if your numbers sit mostly in Google Sheets, Google Ads and Google Analytics, if many people need to view the dashboard, or if anyone who builds it works on a Mac.
- For your group, the practice software and Xero need a spreadsheet in between either way, marketing data is already in Google, and eight people need to view it. That points to Data Studio for the first dashboard, with one catch for a Microsoft 365 office: each of the eight signs in with a Google account to see their clinic. They can make one with their work email, but it's one more login to look after, and when a manager leaves, someone has to take their email off the sheet and the report, because closing their Microsoft 365 account doesn't close the Google one. If you're on E5, the licences cost the same either way, so weigh those Google logins against Power BI's steeper learning curve and a builder on Windows. Otherwise, Power BI earns its cost later, if the definitions get complicated or more systems join in.
Over a year, the Data Studio route costs about A$157 on Make's plan or A$348 on Zapier's, plus the time to build it. The Power BI route needs the same connector app, plus the A$2,016 in licences unless you're on E5.
Either way, a spreadsheet in between
Neither tool reads your practice software or Xero on its own. Data Studio needs a connector sold by another company, and Xero isn't in Microsoft's list of Power BI connectors. So for either tool, the simple route is a spreadsheet in between, with one row a day for each clinic.
Something has to fill it. A connector app such as Make or Zapier can copy the numbers from Xero each morning, with paid plans from US$9 (about A$13) and US$19.99 (about A$29) a month, paid yearly (checked 7 November 2026). Ask your practice software's provider whether it connects to those apps too. If it doesn't, someone exports its weekly report and pastes it in, and those numbers run a week behind.
Over a year, the Data Studio route costs about A$157 on Make's plan or A$348 on Zapier's, plus the time to build it. The Power BI route needs the same connector app, plus the A$2,016 in licences.
The tool is the last decision, not the first. Pick the five numbers, such as appointments booked, cancellations, new patients, revenue and cash in the bank, write down how each one is worked out, and get them into the sheet each day. Our post on building a live KPI dashboard without coding walks through that with Data Studio: about a day if you've built automations before, and two or three if you haven't. The same steps work with Excel and Power BI. If you're still deciding between kinds of dashboard, including ready-made ones, our post on the best KPI dashboard for Australian service businesses sets them side by side.
Start this week
- 01Count who needs to view it, and multiply by A$21 a month for Power BI, unless your Microsoft 365 plan is E5. For Data Studio, check that each of them has, or will make, a Google account.
- 02List where your five numbers live, and how many are in Google tools or in Microsoft ones.
- 03Ask your practice software's provider whether it connects to Make or Zapier, or can export a report on a schedule.
If you'd rather have it built, we set up dashboards in either tool, connected to your practice software, Xero and Google Ads, with the targets and colours in place. That's part of our Dashboards & Reporting service.
If you'd like a second pair of eyes, book a 15-minute call with our team in Sydney, by phone or video. Bring the list of your systems and how many people need to see the numbers, and we'll tell you which tool fits and how your practice software can feed it, so you leave knowing where to start. There's no obligation after the call, and we don't upsell.
SEE HOW WE FIX THIS
See the exact system we build to fix this
Show me which reporting stack fits our business now
WRITTEN BY
Felipe Chaparro
Systems Architect and Founder of SYSBILT. Felipe engineers custom automation, AI workflows, and performance web architectures for scaling Australian service businesses.