
How to build a live KPI dashboard without coding: five numbers from Xero and your CRM, a Google Sheet, Data Studio, and four steps with times.
IN THIS ARTICLE
- //What you'll end up with
- //Before you build: five numbers, written down
- //Step 1: Set up the sheet
- //Step 2: Have a connector app fill it each morning
- //Step 3: Build the page in Data Studio
- //Step 4: Share it, and give it an owner
- //What can go wrong, and who fixes it
- //If your firm runs on Microsoft 365
- //Start this week
Every Monday, you open Xero for invoices and cash, HubSpot for proposals and enquiries, and a spreadsheet someone meant to update. By the time the numbers are in one place, the meeting has started.
Here's how to build a live KPI dashboard without coding for a firm like yours: five numbers on one screen, refreshed every morning from Xero and HubSpot, in tools you can set up yourself: about a day if you've built automations before, and two or three if you haven't.
The short answer
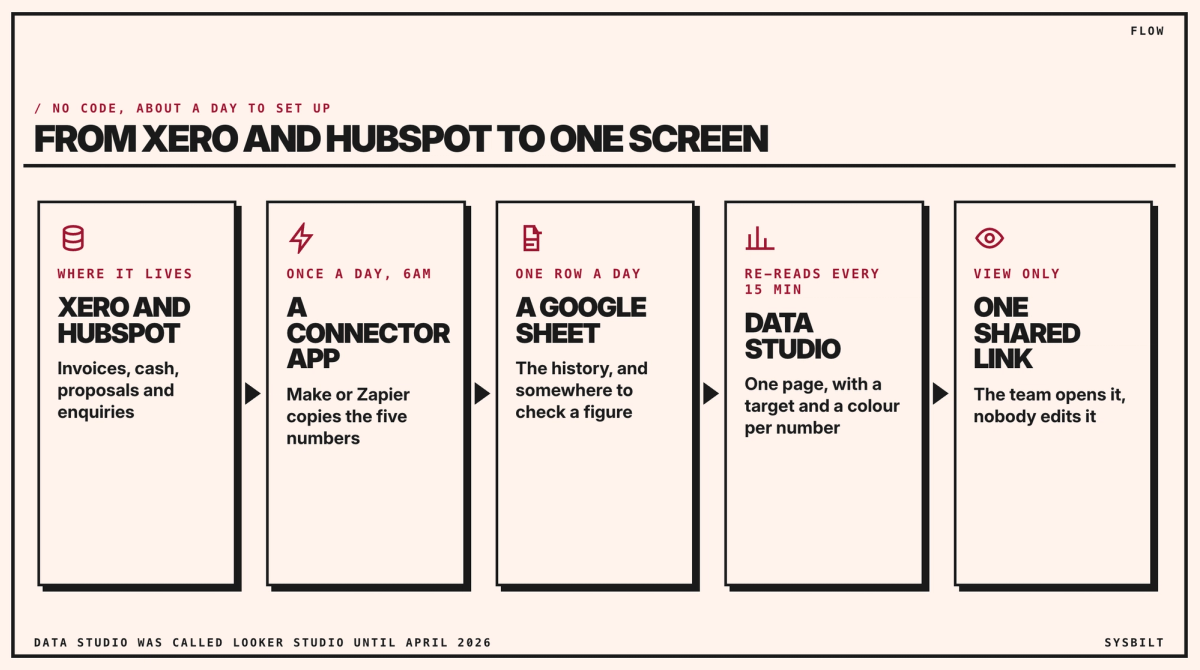
To build a live KPI dashboard without coding, write down five numbers and where each one lives. Have a connector app copy them from Xero and your CRM into a Google Sheet every morning. Then point Google's Data Studio, which has a free version, at the sheet, give each number a target and a colour, and share the link.
What you'll end up with
Each morning, a connector app reads Xero and HubSpot and adds a row of numbers to a Google Sheet. Data Studio, Google's dashboard tool, which you may know as Looker Studio, its name until April 2026, reads the sheet and shows the numbers on one page, with a target and a colour for each. Your team opens one link.
The sheet in the middle is the simple part that makes it work. Data Studio reads Google Sheets on its own, but to read Xero or HubSpot directly it needs a connector sold by another company. A sheet also gives you a history of every number, row by row, and somewhere to check a figure when it looks wrong.
Before you build: five numbers, written down
Pick the numbers first, because they decide what the connector app has to read. Write a one-line definition for each, so everyone reads it the same way:
| Number | How it's worked out | Where it lives |
|---|---|---|
| Invoiced this month | Invoices dated from the 1st of the month, before GST, so it resets each month | Xero |
| Cash in the bank | The statement balance Xero shows from the bank feed | Xero |
| Overdue invoices | Unpaid invoices past their due date, in dollars | Xero |
| Proposals out | The value of deals at the Proposal sent stage, or whatever your pipeline calls it | HubSpot |
| New enquiries | New contacts from the website form that day; the page adds up the last seven days | HubSpot |
Our guide to business KPIs and dashboards covers how to choose your own and set their targets.
Step 1: Set up the sheet
About 30 minutes. Create a Google Sheet with two tabs:
- Daily: one row a day, with the date in the first column and one column for each of the five numbers.
- Targets: each number's target, and the points where it moves to worth watching and to act now.
Keep the column names exactly as they'll appear on the dashboard. Renaming a column later breaks the charts that use it.
Step 2: Have a connector app fill it each morning
An afternoon. A connector app watches for something to happen in one app, or runs on a schedule, and then does a step in another. Here, it runs at 6am each day, reads the five numbers from Xero and HubSpot, and adds a new row to the Daily tab, so yesterday's row stays as history. In Make, one of these is called a scenario; in Zapier, a Zap.
Here's how one number works, overdue invoices:
- 01A schedule starts it at 6am.
- 02A Xero step asks for every invoice that's awaiting payment, Xero's status for an approved invoice not yet paid, with a due date before today. The filter goes in this step's settings.
- 03A step adds up what's still owed on them. Make has a built-in step that adds up a list; Zapier can do it with a few more steps.
- 04A Google Sheets step adds the total to today's row.
Invoiced this month works the same way, with the filter set to invoices dated from the 1st of this month, adding up their totals before GST. Cash in the bank is a single figure, so it takes one step. The adding-up steps are the fiddliest part, so they're the ones to test first. Proposals out and new enquiries come from HubSpot's deals and contacts. If nobody in your firm sets up automations, this is the step to hand to someone who builds them, for a fixed price.
Make starts at US$10.59 (about A$15) a month for 5,000 credits, or US$9 (about A$13) a month paid yearly. Zapier starts at US$29.99 (about A$43) a month for 750 tasks, or US$19.99 (about A$29) a month paid yearly. Both have a free plan to test with. We'd expect a daily run like this to use a few hundred credits or tasks a month, but check the usage page after the first week before you choose a plan. Prices checked 7 November 2026, so they may have changed. Australian dollars are at the Reserve Bank's rate on 6 November (A$1 = US$0.69).
Run it by hand for a week and compare each row with Xero and HubSpot before you trust it.
Step 3: Build the page in Data Studio
About two hours. In Data Studio, add the sheet as a data source. Data from Google Sheets refreshes every 15 minutes by default, so the page is never more than a quarter of an hour behind the sheet (Google). Then build one page:
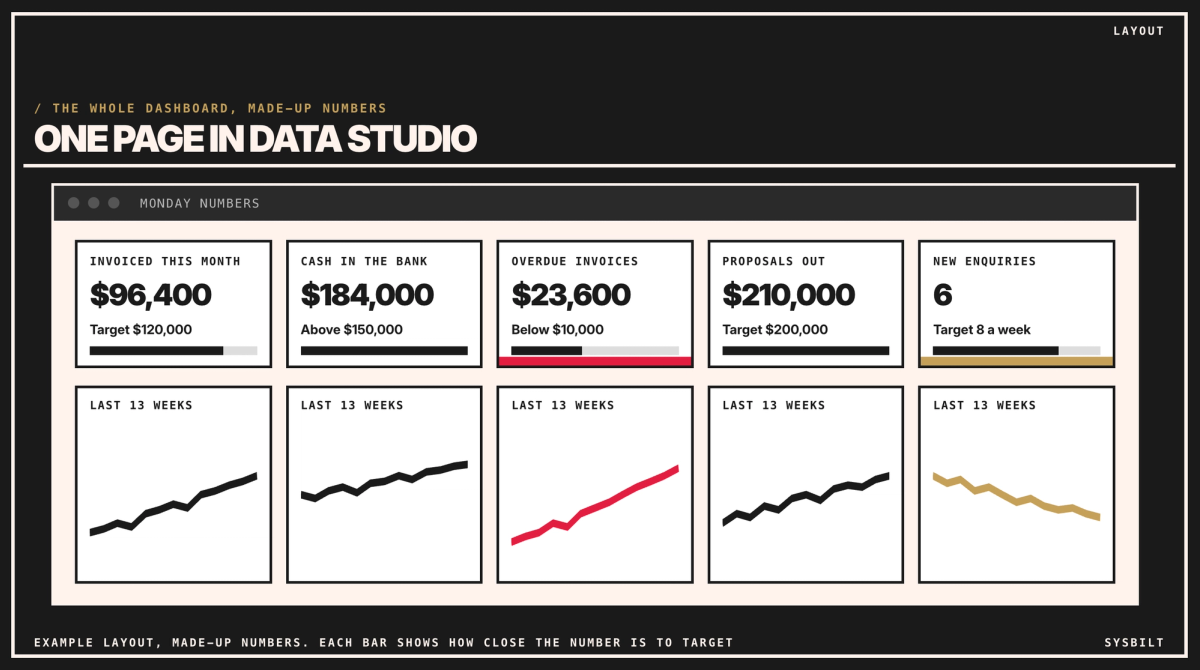
- 01Five scorecards across the top, one per number. A scorecard is a box showing a single number. Click it, and its settings open on the right: set the comparison to a fixed value and type the target from your Targets tab, so it shows how far off it is.
- 02A colour for each, with a formatting rule on the scorecard: gold below the point where it's worth watching, red below the point where it's time to act (Google). For a number where lower is better, such as overdue invoices, turn the rule round: gold above the point where it's worth watching, red above the point where it's time to act.
- 03A small trend chart under each scorecard, showing that number over the last 13 weeks. Each gets its own chart, because dollars and enquiries don't share a scale. Invoiced this month resets on the 1st, so chart its completed months instead.
Leave everything else off. If someone asks for a sixth number, it waits until the first five are being read every week. The bar under each number shows how close it is to target. In the example page, with made-up numbers, invoiced this month shows $96,400 against a target of $120,000, cash in the bank $184,000 against a floor of $150,000, overdue invoices $23,600 in red against a limit of $10,000, proposals out $210,000 against $200,000, and new enquiries 6 in gold against 8 a week.
Step 4: Share it, and give it an owner
About 30 minutes. Share the page with view access, like a Google Doc, so your team can open it but not change it. Share it with named people rather than anyone with the link, because it shows your cash, and keep the sheet itself shared only with the dashboard's owner and whoever built the connector app. Then decide two things:
- Who looks at it, and when: the five numbers open your Monday meeting.
- Who looks after it: one person checks the sheet each week and fixes anything that breaks.
What can go wrong, and who fixes it
- A connection expires. Xero and HubSpot occasionally ask the connector app to sign in again. Both Make and Zapier can email you when a run fails, so send that email to the person who looks after the dashboard.
- Someone renames something. A renamed deal stage in HubSpot or a renamed column in the sheet stops the numbers updating. Agree that nobody changes them without telling the owner.
- A number looks wrong. Check the row in the sheet against Xero or HubSpot. If the sheet is right, the problem is the dashboard; if it's wrong, it's the connector app.
If your firm runs on Microsoft 365
The same four steps work with an Excel file in OneDrive in place of the Google Sheet, and Power BI in place of Data Studio. Sharing a Power BI page with your team needs its Pro plan, at A$21 a user a month plus GST, paid yearly (Microsoft, checked 7 November 2026). Our post on Data Studio, formerly Looker Studio, vs Power BI compares the two, and our post on the best KPI dashboard for a service business, under Related articles at the end of this page, covers the other kinds.
Start this week
- 01Write down your five numbers, with a definition and where each one lives.
- 02Set up the sheet, with the Daily and Targets tabs.
- 03Book the afternoon for the connector app, or ask whoever sets up your automations.
If you'd rather have it built, we set up dashboards like this one, from the connector app to the page, with the targets and colours in place. That's part of our Dashboards & Reporting service.
If you'd like a second pair of eyes, book a 15-minute call with our team in Sydney, by phone or video. Bring your five numbers and the apps they live in, and we'll check whether this build fits, so you leave knowing what to set up first. There's no obligation after the call, and we don't upsell.

WRITTEN BY
Felipe Chaparro
Systems Architect and Founder of SYSBILT. Felipe engineers custom automation, AI workflows, and performance web architectures for scaling Australian service businesses.