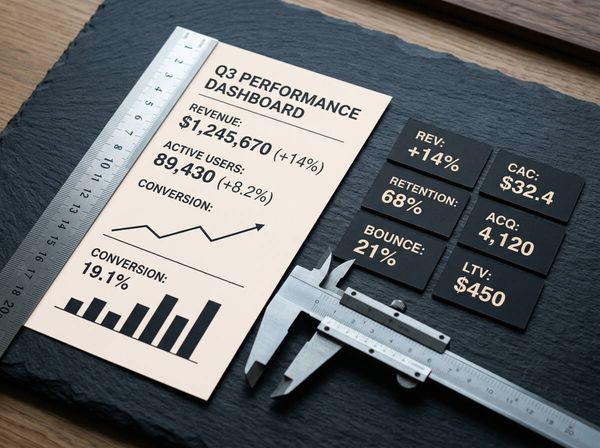
Most $5M businesses track too many metrics or none at all. Here are the five weekly KPIs that actually matter and how to see them in real time.
IN THIS ARTICLE
When your business reaches seven-figure revenue, the way you've been managing it stops working. Checking your bank balance, waiting for your accountant's monthly report, and relying on gut-feel to make hiring and spending decisions got you here, but it won't get you further.
This post covers the five KPIs that matter at this specific stage, why monthly reporting is already too late, and what a weekly review looks like in practice.
The Seven-Figure Inflection Point
At this revenue stage, your business has real complexity. You've got payroll for a growing team, multiple active projects running simultaneously, marketing spend across several channels, and supplier commitments that compound every month. The money in your bank account today is already spoken for by obligations landing next week.
Yet most owners at this stage are still managing the same way they did at a fraction of that revenue. The bank balance becomes the dashboard, the monthly report becomes the review, and everything else runs on memory. That works until the number of moving parts outgrows what one person can hold in their head.
The paradox is that growth makes the problem worse, not better. More revenue means more moving parts, more people, more commitments, and more places for cash to get trapped. If you can't see what's happening in real time, you're making decisions based on memory and instinct while the stakes keep climbing.
"Measurement is the first step that leads to control and eventually to improvement. If you can't measure something, you can't understand it. If you can't understand it, you can't control it."
Five KPIs Worth Tracking Every Week
Every competitor article lists 10 or 15 metrics. At this revenue stage, that's noise. You need five numbers that tell you whether the business is healthy or heading for trouble. Here they are.
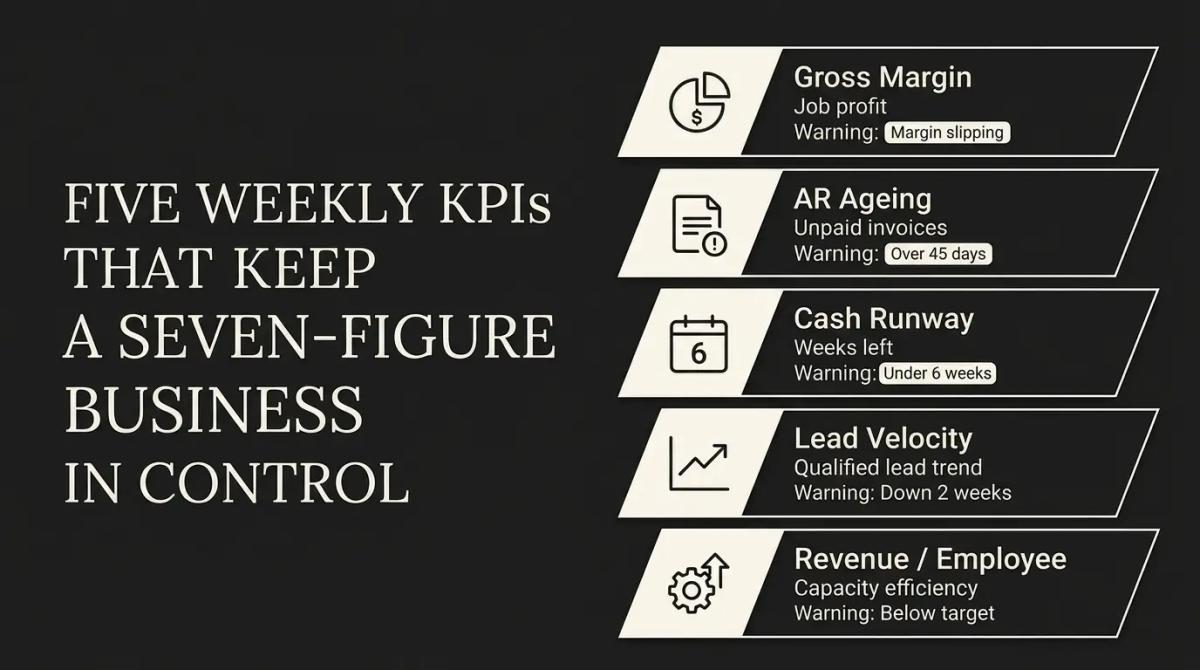
- Gross profit margin per job. Not your overall margin. The margin on each completed job or project. If your materials and labour costs are creeping up but your pricing stays flat, you won't see it in the P&L until it's too late. Track it per job, every week, the moment the work is delivered.
- Accounts receivable ageing. Who owes you money, how much, and how many days overdue. A seven-figure business can easily have a significant portion of revenue sitting in unpaid invoices. If that number is growing faster than your revenue, you have a collection problem that your profit report won't show you.
- Cash runway. If all incoming revenue stopped tomorrow, how many weeks could the business survive? You should never have to guess this number. It's your bank balance minus committed costs, divided by your weekly burn rate. When it drops below six weeks, you need to act.
- Lead velocity rate. Revenue is a lagging indicator. Lead velocity, the growth rate of qualified leads week over week, is a leading one. If your leads slow down this week, your revenue will drop next month. This gives you time to adjust before the hit arrives.
- Revenue per employee. Total revenue divided by headcount, tracked as a trend rather than against an external benchmark. The useful comparison is your own number three months ago. If it's falling while you're hiring, you're adding headcount faster than you're adding capacity. That's a margin trap.
Why Monthly Reports Are Already Too Late
Most owners at this stage see their numbers once a month, when the bookkeeper closes the books. That means hiring decisions, project spend approvals, and supplier contracts all get signed against data that is already 30 days old, and sometimes 90 days old.
The cost of that lag is not abstract. A margin problem that starts in week one is four quotes old by the time a monthly report surfaces it. An invoice that slips past terms in week two has had a month to age before anyone picks up the phone. The lag doesn't just delay the news, it compounds the damage.
The businesses that survive a growth phase aren't necessarily smarter or better funded. They see problems earlier because they're looking at the right numbers at the right frequency. Weekly beats monthly. Every time.
What a Weekly Review Actually Looks Like
You don't need a finance team or a custom-built platform. You need your existing tools connected to a single screen that updates automatically.
The practical stack for most Australian service businesses looks like this:
- Financial data comes from Xero or MYOB
- Sales and pipeline data comes from HubSpot or your CRM
- Visualisation happens in Google Looker Studio or Power BI
An API connector like Make.com pulls data from each source into a dashboard that refreshes in real time. No manual exports, no Friday afternoon spreadsheet sessions, no waiting for the bookkeeper.
The weekly review itself takes 15 minutes. Every Friday afternoon, you open one screen and check five numbers. Gross margin trending down on recent jobs? Investigate before you quote the next one. AR ageing climbing past 45 days? Get on the phone Monday. Lead velocity dropping two weeks in a row? Adjust your ad spend before next month's pipeline dries up.
None of this is complex. It's consistency. The same five numbers, the same screen, the same 15 minutes, every week.
Start This Week
You don't need a six-month implementation plan. You need three actions, and you can start all of them this week.
- 01Pick your five. Use the list above as a starting point, then adjust based on what matters most in your business right now. The right five KPIs for a trades company are different from the right five for a consulting firm, but the structure is the same
- 02Connect your data sources. If your numbers live in Xero, HubSpot, and a Google Sheet, connect them to a single dashboard. If you want a more detailed walkthrough, read How to Build a Live KPI Dashboard Without Coding
- 03Set a recurring 15-minute review. Block it on your calendar. Friday afternoon works well because it gives you the weekend to think and Monday to act. If your cash situation feels tighter than your revenue suggests, Why Is My Business Growing But I Have No Cash explains where the leaks are hiding
At this revenue stage, you can't afford to manage by memory. The businesses that scale past this point are the ones that see their numbers clearly, every week, on one screen, and act on what they see before it becomes an emergency.
If this sounds like where your business is right now, book a call and we'll walk you through what a weekly dashboard looks like for your situation.
SEE HOW WE FIX THIS
See the exact system we build to fix this
Show me what my weekly dashboard should look like
WRITTEN BY
Felipe Chaparro
Systems Architect and Founder of SYSBILT. Felipe engineers custom automation, AI workflows, and performance web architectures for scaling Australian service businesses.